The majority of analysts have re-built the same report several times. A stakeholder requests a dashboard; the analyst designs it, and after a couple of weeks, the stakeholder asks for a different version. Then another. All versions are reasonable independently. When combined, they form a burden on maintenance and numbers that don't add up.
I'm a senior data analyst for a financial services organization, and I process 6-8 ad hoc analytical requests a week, in addition to my dashboard work. Previously, as a business analyst, I combined 23 separate, manual Excel reports into a centralized, automated dashboard and reduced data cleaning, validation, and structuring by 75 percent. In both cases, it was not the data but the way the reports were written. It is the way the requirements are collected.
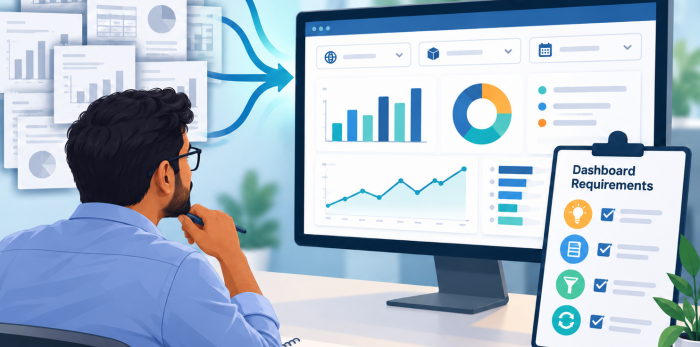
Requests describe outputs, not needs
A typical request says, "I need a report showing X by Y." That is a description of an output. It does not say what decision the stakeholder is trying to make, how often they make it or what they will do differently depending on the answer.
When analysts build exactly what is requested, they often meet the letter of the request and miss its purpose. The stakeholder comes back with a follow-up because the first version did not quite answer their real question.
Ask about the decision first
The one question that is always the most helpful is, “With this, what will you do?” The response typically changes the request. A request for a monthly report by region may, in fact, be a call to action to hire a Personnel Representative in that area. This decision might require a forecast, not a history, and a comparison with capacity, not a list of totals.
Other questions follow naturally. How often is the decision made? Who else is involved? What would make you confident in the answer? What would you do if the number were higher or lower than expected?
Write the requirement in business language
I write a short requirement for every dashboard and every recurring report, in language the stakeholders can read and confirm. It includes the decision being supported, the main questions the view must answer, the definitions of each measure, the level of detail, the refresh frequency and the intended audience.
That document becomes the reference when new requests arrive. If a new request supports the same decision, it may be a change to an existing view rather than a new report. If it supports a different decision, it gets its own requirement.
Agree definitions before building
Many follow-up requests arise because a measure was defined differently from what the stakeholder expected. Active customers, completed applications and on-time delivery all have several reasonable definitions. Agreeing on the definition in writing before any data is pulled prevents a large share of rework.
I then combined the twenty-three reports and discovered that some of them used varying definitions of the same measure. It took longer to reconcile those definitions than it did to build the dashboard, and that's what made the dashboard trusted.
Validate with real data early
Stakeholders may not be able to make judgments on requirements in isolation. Early in the process, misunderstandings manifest when people are shown a rough draft based on real data; they are more easily corrected at this stage because it is less costly. I just propose a very simple draft, ask the question and edit it before spending on design and automation.
This approach also helps stakeholders refine their own thinking. Seeing real numbers often prompts a better question than the one they started with.
Build once, filter many times
Many requests are variations of the same view with different filters. Instead of building separate reports, I design dashboards with clear filters for the dimensions stakeholders care about, such as region, product or time period. One well-designed view with sensible filters can replace several static reports.
In the past, I created reports using Microsoft's business intelligence platform for over 67 international products. To maintain that manageable, the only option was to create shared views containing filters as opposed to separate reports for each product.
Automate the preparation
If the data used to build a dashboard is pulled together manually, then the requirements work are done in vain. Manual preparation is prone to errors and is time-consuming. I create data preparation tasks as workflows (usually in Alteryx and SQL). Currently, those workflows are automated, which halves manual processing time and delivers more accurate data.
Handle ad hoc requests with a light process
Not all requests require a complete requirement document. I use a 3-line note for ad hoc questions, which includes the question, the decision, and the definition of any measure(s) used. This note takes one minute to record and is saved in the query. If the same question comes up again, the previous answer and its assumptions are readily available. Patterns in ad hoc requests over time indicate which questions should be treated as permanent views.
Review usage and retire what is not used
Reports pile up because no one turns them off. I check who is opening the dashboards/reports and what dashboards/reports are being opened. Frequently, views not in use are talked about and retired. This helps to keep the reportable estate manageable.
A requirements checklist for dashboards
- Decision. With this perspective, what will the stakeholder do?
- Questions. What are the exact questions that it has to answer?
- Definitions. In writing, explain how each measure is calculated.
- Detail and frequency. How detailed and how often?
- Audience. Who are the users, and how will they be used?
- Draft review. Are there any early data for the stakeholder?
- Retirement. What are the current reports that are being replaced by this report?
Analysts as partners, not order takers
Business analysts and data analysts share a common challenge: turning a stakeholder's request into something that actually helps them. The analysts who do this well spend less time building and more time understanding. They ask about decisions, write clear requirements, agree on definitions and design for reuse.
The result is fewer reports, more trust in the numbers and more time for the analysis that stakeholders value most, which is where analysts add the greatest value.
Author: Pratik Mahajan, Senior Data Analyst, Financial Services Analytics
Pratik Mahajan is a senior data analyst in financial services based in Plano, Texas, with more than five years of experience in business intelligence, data engineering and dashboard development. He builds automated data pipelines and dashboards in Tableau, Sigma, Databricks, Alteryx, SQL and Python, including workforce and hiring analytics for early career programs. He has written for VKTR on hiring quality as operational risk and on data lineage in enterprise artificial intelligence, and holds a master's degree in data analytics and information technology from Rutgers University.