In a recent article on the Top 10 Skills a New Business Analyst Should Shore Up On, #6 was identified as creating visual models.
Most BAs tend to have a natural preference for either textual or visual models. Requirements specifications ideally include both types of information, as different stakeholders learn in different ways.
Visual models don’t have to be complicated. Unless your organization uses formal UML or BPMN standards, focus on learning to create simple visual models.
In this article, we’ll explore 3 simple visual models that a new business analyst should be skilled in creating because they add a lot of value to projects and generally improve your requirements documentation. Then we’ll look at how you can begin using more visual models in your projects right away.
Visual Model #1 – Process Flow Diagram
Process Flow Diagrams are an intuitive way for stakeholders to understand the organization’s fundamental processes, get clarity on how work gets done, and appreciate how value is delivered. They also put other requirements activities in context. For example, a business process diagram can help facilitate more effective use case reviews by providing context for how the system functionality will support the business process.

Process Flow Diagrams exist in multiple forms. Most BAs create simple workflow diagrams that show the end-to-end business process. These diagrams contain boxes for each activity step, diamonds for any decisions or variations in the process, and a series of arrows to clarify the sequence of steps in the process. Swim lanes may be used to show who or what is responsible for each step in the process.
A smaller subset of BAs use BPMN (Business Process Modeling Notation) to create more formalized diagrams. Conceptually, BPMN diagrams are similar to workflow diagrams. However, the BPMN notation contains a much larger number of formal elements and so the BPMN diagrams tend to be more visually complex. The complexity can be useful if your process requires it. Otherwise the notation can make it more difficult for stakeholders to comprehend and approve your process models.
If you are new to this skill set, focus first on learning how to create workflow diagrams and visually model processes. Then, as your situation warrants, explore a more complex notation like BPMN.
Visual Model #2 – Business Domain Model
Business Domain Models clarify the information created and managed by an organization without diving deep into the database structures. Creating and walking through a model like this can often clear up misunderstandings and get everyone speaking the same language.
Essentially, a business domain model visually presents information that might be included in a glossary or data dictionary. This way, you can show not only what terms mean but how the relate together.
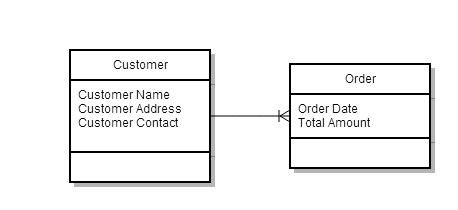
In a Business Domain Model, each key concept gets a box. Important attributes for each concept are listed within each box. Lines connecting the boxes show the relationships between concepts.
For example, a Business Domain Model might contain a box for the concept of “Customer” and attributes for Customer Name, Customer Address, and Customer Contact. The Customer concept might have a 1-to-many relationship to the concept of “Order” which has attributes for Order Date and Total Amount.
Business Domain Models can be created using the same notation as an Entity Relationship Diagram (or ERD)and they tend to look a lot like logical or physical data models. However, they tend to be less complex than data models and focus only on the information concepts critical to understanding how the business works.
If this is a new skill set, focus on keeping your domain models simple and business-driven. Later on you can get deeper into the complex relationships that exist within physical databases.
Visual Model #3 – User Interface Wireframes
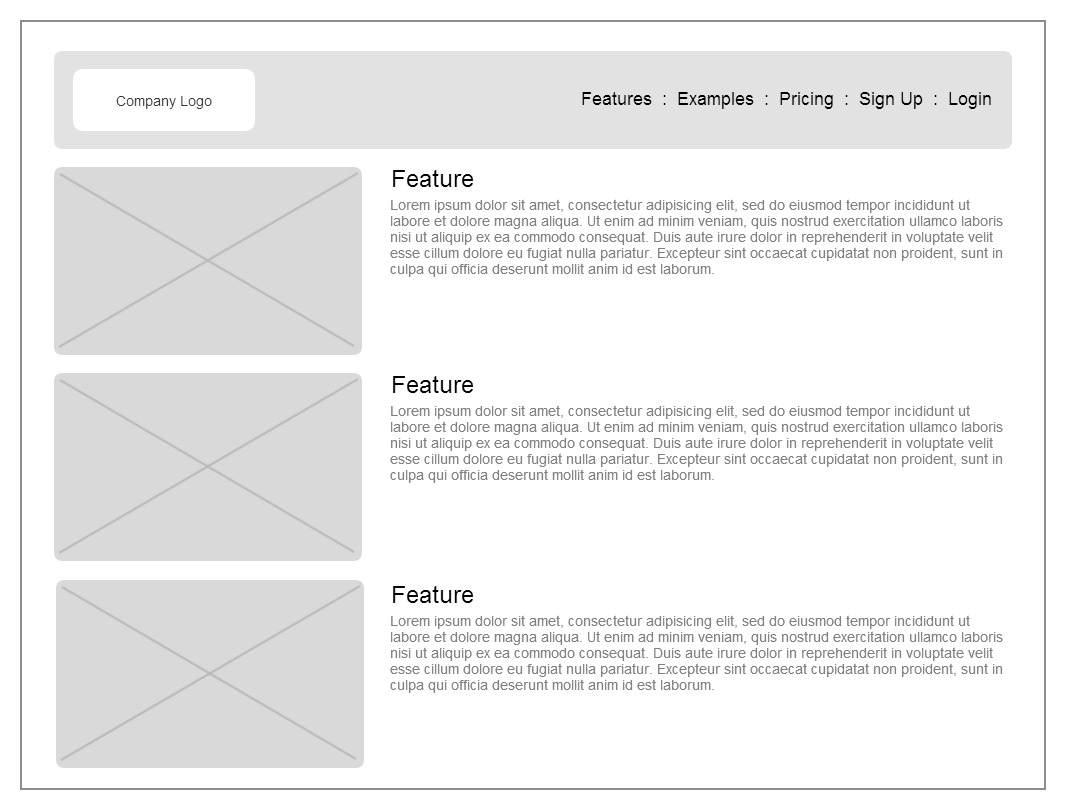
A User Interface (UI) Wireframe is a visual rendering of how a specific screen to be implemented as part of a software solution will be laid out. They are useful in generating “yes, but” conversations and eliciting information stakeholders don’t think of until they see what an application might look like.
UI Wireframes, also often called Prototypes or Mock-Ups, can vary in fidelity, or the degree to which the presentation of the user interface is intended to be realized in the final application.
-
A low-fidelity UI prototype may show the general layout of the screen but not the specific UI elements.
-
A medium-fidelity UI prototype will show the UI elements on the screen but may not represent the actual look.
-
A high-fidelity UI prototype, often called a rendering, will represent exactly how the UI should look and feel once implemented.
Typically, a business analyst is responsible for either low-fidelity or medium-fidelity prototypes, while a graphic designer, user experience expert, or technology lead might be responsible for high-fidelity prototypes, if they are even required for your project.
If this is a new skill set, focus on creating lower-fidelity user interface prototypes and using them to drive conversations about intended software functionality and key business processes.
Using Visual Models
Visual models help you communicate, clarify, and analyze the requirements. As a new business analyst, it’s critical to have some core visual modeling skills as you’ll be better prepared to handle complex analysis tasks and figure out solutions to difficult problems.
While there isn’t always a need to learn sophisticated visual modeling techniques or complex visual modeling tools, you do need to pay attention to when a picture will be more effective than words.
The next time a difficult conversation comes up on your project, consider what visual model might help your team work through the problem. Put a draft together, either in a visual modeling tool or using an old-school tool like a whiteboard, and use it as a conversation piece while facilitating a meeting. I suspect you’ll find the conversation begins to go much more productively.
In the absence of access to visual modeling tools, the Smart Art and Shapes features available in the Microsoft Office Suite can help you get started and there are a variety of online visual modeling tools that offer free or reduced cost trials.
Whatever you do, just start modeling! With a little bit of practice and creativity, you’ll become well-versed in a variety of visual modeling techniques.
Author: Laura Brandenburg, CBAP is the author of How to Start a Business Analyst Career, the host of Bridging the Gap, and offers a BA career planning course (it’s free) to help you start your business analyst career.