(Why Single Decision Tables are Just Not Good Enough Anymore!)
Portions of this article are drawn from the book, The Decision Model: A Business Logic Framework Linking Business and Technology, von Halle & Goldberg, © 2009 Auerbach Publications/Taylor & Francis, LLC. This article consists, in part, of abstracts from the book; directly quoted passages, diagrams and tables are cited, and are copyright © 2009 Auerbach Publications/Taylor & Francis LLC. Reprinted with the permission of the Publisher
Previously, this column[1] proposed that single, unconnected decision tables evolve into whole decision models. It provided a step-by-step process for transforming common decision tables into a decision model. This month’s column goes one step further by associating each transformation step with the principles of The Decision Model justifying it. This correlation explains how The Decision Model unfolds in step-by-step fashion like a science.
The subtitle above is “Why Single Decision Tables are Just Not Good Enough Anymore!” That’s not to imply that decision tables are not useful. To the contrary, they have been applied in practice for many years and have proven very useful. In fact, The Object Management Group (i.e., an IT standards group also known as OMG) has a subcommittee called Decision Model and Notation (i.e., also known as DMN) which is addressing rigor for decision tables [2].
This month’s column is not a debate about decision table theory versus decision model theory. Instead, it focuses on current practices for decision tables and those of The Decision Model. It covers (1) Four Benefits of Decision Tables (2) Decision Tables in Practice (3) The Decision Model in Practice (4) The Science Behind the Transformation Steps and (5) Wrap Up: A Leap in Maturity.
Four Benefits of Decision Tables in Practice
It is important to recognize benefits of decision tables so as not to lose themin the transformation. These are:
-
A decision table is an intuitive visual representation. This circumvents the need for other less friendly representations – such as formal language, strict grammar rules or fill-in-the-blank sentence templates.
-
Both business people and technical professionals understand a decision tableif it is devoid of technical artifacts.
-
Some forms of incompleteness, inconsistency, and redundancy become visible ina decision table.
-
Certain technologies lend themselves to easy automation of decision tables. In fact, most Business Rule Engines (or Business Rule Management Systems, BRMS) accept decision tables as a format for creating and making some changes. That’s because automation ofdecision tables into such engines is fairly straight-forward.
Decision Tables in Practice
Because decision tables are so useful and intuitive, they are widely used. Three aspects of decision tables in practice are worth exploring: different representations, normalization violations, and lack of connections.
Common Practice #1: Different Representations
There is no single format for decision tables. Instead, many variations exist in practice. Figure 1illustrates three of them.
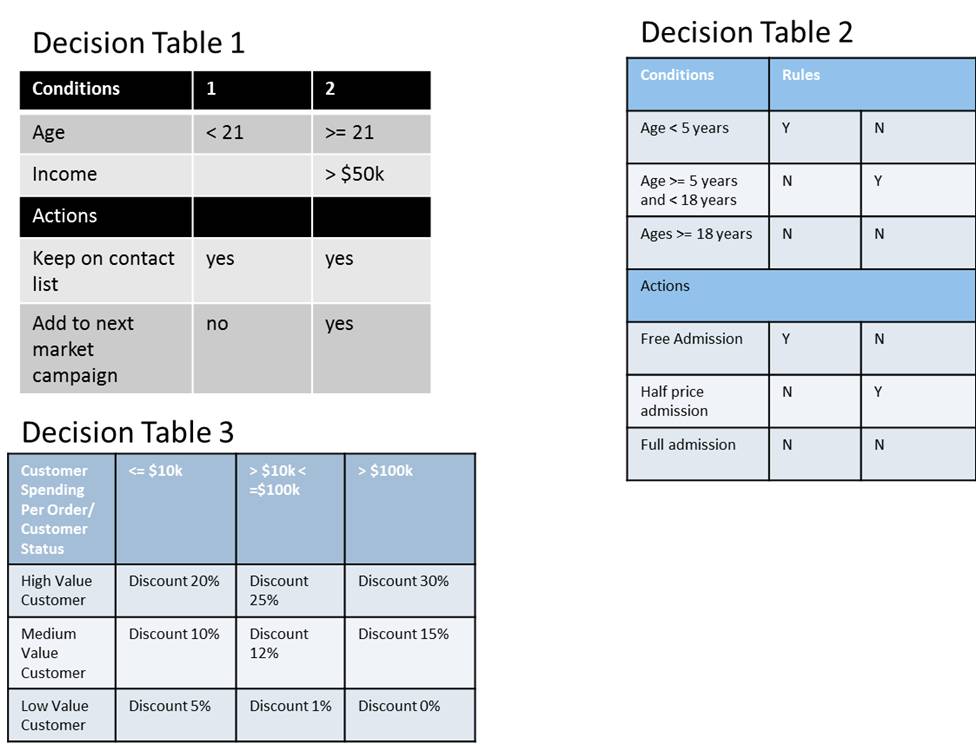
Figure 1: Common Decision Table Formats in Practice
In Decision Table 1, the condition names appear in the first column and in the first two rows under the row labeled “Conditions”. These conditions are Age and Income. Actions appear in the first column in the bottom two rows under the row labeled “Actions”. These actions are “Keep on contact list” and “Add to next market campaign”. The details of conditions and actions are in the other cells. The interpretation of the column labeled “1” is “if Age < 21 then Keep on contact list is yes and Add to next market campaign is no.”
Decision Table 2 has conditions and actions listed in the first column but not quite the same way as Decision Table 1 and seems constrained to y/n.
In Decision Table 3, the condition and conclusion names appear combined in the top left cell. These are “Customer Spending Per Order” and “Customer Status”. The values for conditions appear in the top row for “Customer Spending per Order” and in the left most column for “Customer Status”. The values for the conclusion are in the remaining cells. The interpretation for the column labeled <=$10k and row labeled “High Value Customer” is “if Customer Status is High Value Customer and Customer Spending Per Order <= $10k then Discount20%”.
Figure 1 illustrates that among these three representations, different parts of the logic are in different parts of the table and names are not very rigid.
Shortcomings
Decision tables in multiple formats add a level of complexity. Specifically, to interpret a particular decision table, the observer must first decipher its configuration and also the corresponding ways to find errors.
Each of the formats in Figure 1 has its weaknesses. Decision tables 1 and 2 add complexity if you wish to connect them to others. That’s because connections among decision tables would be from conclusions in one to conditions to another. If there is more than one conclusion in a decision table, the resulting connections become complex. They eerily resemble legacy spaghetti program code, which is proven difficult to maintain.
Decision table 3 is limiting in that it handles two types of conditions easily (i.e., Customer Spending Per Order and Customer Status). What if there are more than two conditions? In the real world, the average Rule Family has five types of conditions. What would that look like using the format of decision table 3?
Common Practice #2: Normalization Violations
Many organizations apply more rigor to their decision tables than shown in Figure 1. Even so, the most common mistakes we find in today’s decision tables are normalization violations.
This means that organizations typically do not apply the rigor of normalization to decision logic in decision tables even though the same organizations apply normalization principles to data in relational tables. The benefits of data normalization (e.g., minimizing unnecessary redundancy therefore increasing quality) are universally understood. However, apparently there is little awareness of the benefits of normalization for business logic.
Shortcomings
The shortcoming is that an un-normalized decision table, by definition, has redundant content. Unnecessary redundancy leads to complex and error prone change management.
Decision table 2 is an example. In the first column of the table, if Age < 5 years, there is no need also to test whether Age >= 5 and < 18 or Age> 18 because these values are already excluded as a possibility. The existence of unnecessary content adds overhead in maintenance and potential for errors.
Let’s look at another example. The decision table in
Table 1below has 6 sets of logic numbered 1 through 6. Looking at its content, if an order is not fulfilled, regardless of the Customer Segment (i.e., High Valued, Medium Valued, or Low Valued), the order qualifies for a special discount. So, Customer Segment is irrelevant to the conclusion [3] . Removing the content of those cells creates the Rule Family in Table 2. Normalization reduces the number of rows or conditions to the minimum without losing any logic.
| CONDITIONS |
1 |
2 |
3 |
4 |
5 |
6 |
| Order Fulfillment Status |
Is Not Filled |
Is Not Filled |
Is Not Filled |
Is Filled |
Is Filled |
Is Filled |
| Customer Segment |
Is High Valued Customer |
Is Medium Valued Customer |
Is Low Valued Customer |
Is High Valued Customer |
Is Medium Valued Customer |
Is Low Valued Customer |
| ACTION |
|
|
|
|
|
|
| Apply Special Discount |
Is Yes |
Is Yes |
Is Yes |
Is Yes |
Is No |
Is No |
Table 1: Example of Un-normalized Decision Table
| Row ID |
Rule Pattern |
Conditions |
Conclusion |
| Order Fulfillment Status |
Customer Segment |
Special Discount Eligibility |
| 1 |
1 |
Is |
Not Filled |
|
|
Is |
Eligible |
| 2 |
2 |
Is |
Filled |
Is |
High Valued Customer |
Is |
Eligible |
| 3 |
2 |
Is |
Filled |
Is |
Medium Valued Customer |
Is |
Not Eligible |
| 4 |
2 |
Is |
Filled |
Is |
Low Valued Customer |
Is |
Not Eligible |
Table 2: Normalized Rule Family
Common Practice #3: Lack of Connections
Most, if not all, organizations create single unconnected decision tables even when it may be possible to connect them together. This practice is probably is the result of thinking at too low a level – that is, focusing primarily on individual rows or individual decision tables and not starting with the higher notion of a business decision supported with a fully connected set of business logic structures behind it.
Shortcomings
Proliferation of unconnected decision tables has negative repercussions on corresponding process models. It usually means the single decision tables are sprinkled across different tasks in a process model.
The Decision Model in Practice
In contrast, The Decision Model in practice has only one core structure defined by its 6 structural principles. It is always normalized. Its principles enforce normalization as the natural only way to group logic statements in a consistent manner. Its principles also enforce inferential relationships as the natural and only way to connect those groups together.
Most important, The Decision Model in practice, by name and definition, is a model not a single table of rows. That is, each decision model diagram begins with the graphical representation of a business decision, associated with business motivations and metrics. Even decision models comprised of a single Rule Family are regarded as decision models. They do not stand alone, but connect to the notion and graphic of a business decision and its reasons for existing.
The Transformation Steps and the Science behind Them
This section repeats the transformation steps from the previous column and relates them to principles of The Decision Model. The steps start with a common-looking decision model shown in Figure 2. They uncover the natural structure of its internal logic and connect it to a corresponding decision model.
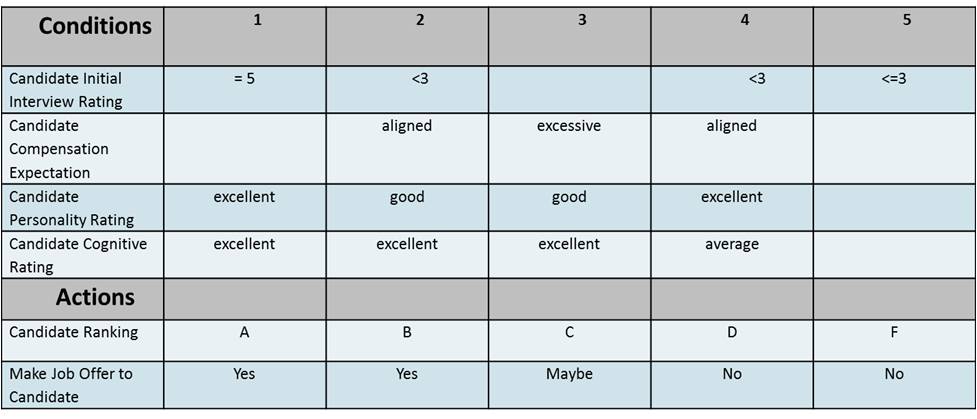
Figure 2: Common Decision Table as Starting Point
The decision table in Figure 2has four conditions listed under the column heading of Conditions. The conditions are Candidate Initial Interview Rating, Candidate Compensation Expectation, Candidate Personality Rating, and Candidate Cognitive Rating. This decision table also has two actions listed under the heading Actions. The actions are Candidate Ranking, and Make Job Offer to Candidate. This decision table also has five sets of business logic, numbered 1 through 5 across the top row. For example, we interpret the column whose heading is the numeral 2 as:
If the Candidate Initial Interview Rating < 3 and the Candidate Compensation Expectation is aligned and the Candidate Personality Rating is good and the Candidate Cognitive Rating is excellent then the Candidate Ranking is A and Make a Job Offer to Candidate is Yes.
The Transformation
The transformation must deliver a model with five important characteristics:
-
It is as simple as possible so that everyone understands it
-
It completely separates business logic from all other concerns so that business logic can change independently
-
Itis sufficiently rigorous so as to deliver a universal look-and-feel
-
Itis technology-independent so that it expresses business intention unconstrained by past, current, or future technology
-
It is free of logic errors.
Step 1: Turn it Sideways
Step 1 begins the transformation by applying Principle #1 because this principle addresses the first characteristic above by delivering the simplest representation.
| Principle #1: The Tabular Principle |
| The fundamental structure of a Decision Model is called a Rule Family and has two dimensions: one dimension is the heading and the other dimension is the body. |
Because a decision table is a two-dimensional structure with heading and body, it serves as a starting point. Principle #1 defines the fundamental structure as one of two-dimensions because such a structure is easy for everyone to understand.
However, Principle #1 does not force the two-dimensional structure to be shown in a particular way. For example, placing the heading down rows is acceptable as is placing the heading across columns. They are equivalent in interpretation. However, placing the heading across columns is usually the preferred way, but not required [4].
Step 1 begins the transformation of a decision table like the one in Figure 2 into one in which conditions and actions are headings across columns rather than down a column.
Step 2: Convert to Fact-Based Headings
Step 2 transforms the headings by applying Principle #2 because Principle #2 addresses the second characteristic above by completely separating business logic from other concerns, specifically actions, tasks, or process.
| Principle #2: The Heading Principle |
| The heading of a Rule Family is a set of fact types. |
Fact types are simply the names of pieces of information. The decision table in Figure 2 contains some conditions that seem to be pieces of information, such as “Candidate Initial interview Rating”. But, it also contains the label Actions which is not a label consistent with pieces of information. Actions are verbs. Pieces of information are nouns.
So step 2 changes the word “Actions” to the word “Conclusion” because a conclusion is a piece of information arrived at by satisfying specific conditions.
The decision table in Figure 2also has as one of its conclusion, the words “Make Job Offer to Candidate,” and as such expresses as an action. So, step 2 changes these words to the name of a piece of information, specifically “Candidate Job Offer Eligibility.”
It is important that the actual action of making a job offer to a candidate does not appear in a decision model. It is external to it, usually part of a task in the process model that follows execution of this logic. Such a task will make a job offer depending on the result of this logic. Decision model Principle #2 prohibits the mixing of logic with actions, thereby creating a clean separation between them.
Step 3: Separate conclusions
Step 3 transforms the conclusion by applying Principle #5 because Principle #5 addresses the third characteristic above by delivering rigor leading to a universal look-and-feel.
| Principle #5: The Conclusion Principle |
| A Rule Family has only one conclusion fact type. |
This simply means that each Rule Family has only one conclusion column. If there is more than one conclusion column, a Rule Family is created for each of them.
In our example, Step 3 results in one Rule Family for the conclusion “Candidate Ranking” and another for the conclusion “Candidate Job Offer Eligibility.” But it also compels us to ask whether these two conclusions are truly directly dependent on the same set of conditions.
Suppose, on closer inspection, it turns out that “Candidate Ranking” of “A” or “B” always implies a “Candidate Job Offer Eligibility” of “yes.” It also turns out that “Candidate Ranking” of “C” infers that “Candidate Job Offer Eligibility” is “maybe.” Further, it turns out that “Candidate Ranking” of “4” or “5” infers that “Candidate Job Offer Eligibility” is always “no”. If all of these are true, the Rule Family for conclusion “Candidate Job Offer Eligibility” reduces to one condition column of “Candidate Ranking.”
Step 3 also applies Principles #3 and 4 to the content of each structure because these principles also deliver rigor leading to universal look-and-feel.
| Principle #3: The Cell Principle |
| The content of each cell of a Rule Family is an atomic logical expression conforming to the heading. |
| Principle #4: The Row Principle |
| The populated cells playing the role of conditions infer the corresponding populated cells playing the role of a conclusion. |
| Principle #6: The Conditions Principle [5] |
| All populated conditions cells must be true for the conclusion cell to be true. (In other words, there are no ORs, OTHERWISES, ELSES). |
Principle #3 enforces rigor between cells and their corresponding heading. Principle #4 enforces the relationship of conditions in a row to conclusions in that row. Principle #6 enforces rigor in interpreting conditions in a row, allowing only one kind of interpretation (i.e., that all conditions must be true for the corresponding conclusion to be true).
After Steps 1-3, part of the decision table from Figure 2 becomes the Rule Family shown in Figure 4.
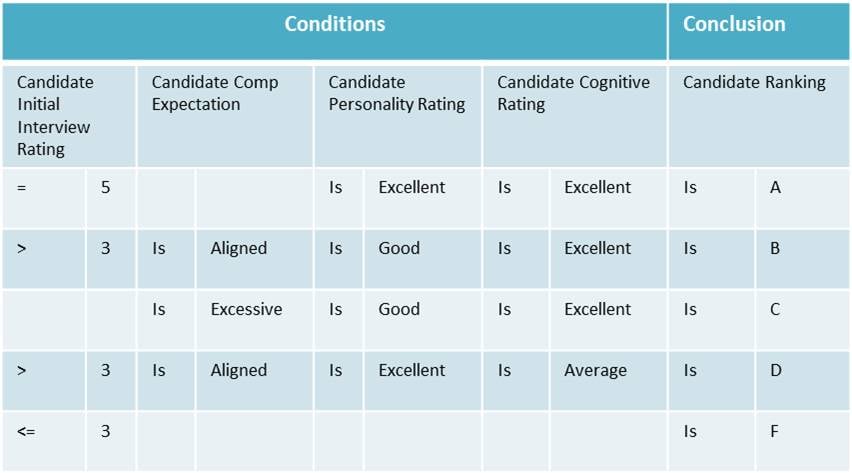
Figure 3: Rule Family Table after Steps 1-3
Step 4: Create a Structural Diagram
Step 4 creates from the Rule Family table a diagram showing only its structure and not its details. It does so by applying Principle #7 because Principle #7 delivers rigor leading to a universal look-and-feel to the graphical representation.
| Principle #7: The Connection Principle |
| A Rule Family has an inferential relationship with another Rule Family when the conclusion fact type of the latter serves as a condition fact type in the former. |
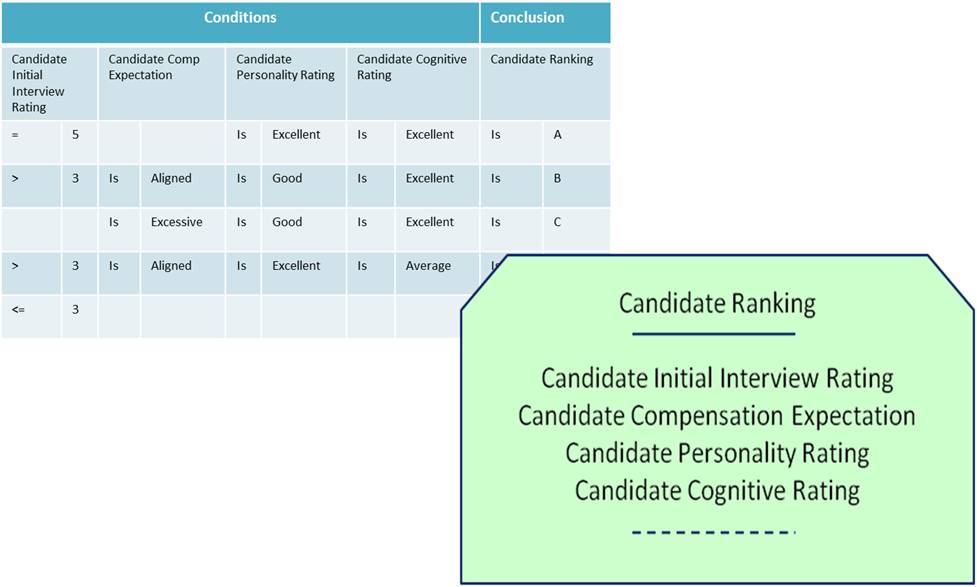
Figure 4: Business Logic in a Rule Family Structure
Figure 4 illustrates a Rule Family graphical representation, and how it reveals all elements of Rule Family structure without exposing the details. The structural diagram for a Rule Family therefore includes a mechanism to identify each of the following:
-
One conclusion: The conclusion is the phrase above the solid line in the green Rule Family shape. In Figure 4, the conclusion is “Candidate Ranking”
-
All conditions: Its conditions are below the solid line. Figure 4 shows four conditions.
-
All connections: Its connections to other Rule Families are the conditions between the solid and dotted line. The Rule Family in Figure 4 has four connections.
-
All input data: All data needed as input appears below the dotted line. There is no input data in Figure 4 yet.
Anyone can tell a lot about the Rule Family and its relationships without seeing its details.
Step 5: Connect Related Rule Families
Step 5 transforms the structure into its place in a whole model and applies Principle #7 to the decision model diagram, again delivering rigor and a universal look-and-feel. Step 5 creates supporting Rule Families for each condition between the solid and dotted lines.
Let’s look at an example. Suppose Personality Rating is a value resulting from evaluation of two conditions, Candidate Maturity Rating and Candidate Integrity Rating. This means there is an inferential relationship between the Rule Family for Candidate Ranking and the one for Candidate Personality Rating as shown in Figure 5.

Figure 5: Inferential Relationship in The Decision Model
Once Rule Families connect to each other, the world of single two-dimensional tables turns into one of model management which offers new innovations. Figure 6 shows an entire decision model.

Figure 6: Complete Decision Model
Step 6: Confirm Remaining Decision Model Principles
The transformation ends with Step 6 which applies to the entire model all 15 principles, with emphasis on Principles #8-15.
Principles #8-10 address the fourth characteristic above because they deliver a model that is technology-independent. They do so by ensuring that that no aspect of the model depends on sequence of processing. The model is therefore purely declarative, meaning that technology can execute it in any sequence because there are no procedural constraints implied by its structure.
Principles #11-14 address the fifth characteristic above by delivering a model that is free of logic errors - complete (no gaps), consistent within itself, and has no unnecessary redundancies.
Principle #15 comes full circle back to the business itself by applying Principle #15 which links that decision to business justifications and metrics.
| Principles #8-10: Declarative Heading, Body, Inferential Relationships Principles |
| The entries in the heading, body, and connections among Rule Families are unordered. |
| Principles #11-14: Integrity Principles |
| A Decision Model is free of logic errors. |
| Principle #15: Business Alignment Principle |
| A Decision Model directly aligns with business directions and metrics for measuring progress. |
Figure 7summarizes each transformation step and its related Decision Model Principles.

Figure 7: Transformation Steps Correlated to The Decision Model Principles
Wrap Up: A Leap in Maturity
In practice, we don’t create decision models by starting with decision tables and following the six transformation steps outlined above. Instead, we create them top down, starting from a business decision, our best-guess at structure, and proceeding to details. The benefit of the top down approach is that it places emphasis on the business importance of each decision and the quality of the decision-making itself. Details come later in support of its importance to the business.
The transition from single decision tables to decision models is a fundamental leap in maturity. This leap has fascinating implications for business and technology.
For the business side, decisions are more important and get more management attention than do decision tables. Decision models become a target for improved business thinking.
On the technology side, innovations for decision model-driven software become possible. These include advanced functionality, such as comparing whole models, validating whole models, creating different decision model views of the same business decision, and the sharing of whole decision models.
The business and technology implications can have a profound effect on organizational maturity and actual business performance. Suffice it to say, for most business decisions, single decision tables and even single Rule Families out of a model context, are just not good enough anymore!
Authors: Barbara von Halle and Larry Goldberg of Knowledge Partners International, LLC (KPI)
 Larry Goldberg is Managing Partner of Knowledge Partners International, LLC (KPI), has over thirty years of experience in building technology based companies on three continents, and in which the focus was rules-based technologies and applications. Commercial applications in which he played a primary architectural role include such diverse domains as healthcare, supply chain, and property & casualty insurance.
 Barbara von Halle is Managing Partner of Knowledge Partners International, LLC (KPI). She is co-inventor of the Decision Model and co-author of The Decision Model: A Business Logic Framework Linking Business and Technology published by Auerbach Publications/Taylor and Francis LLC 2009.
Larry and Barb can be found at www.TheDecisionModel.com.
[1] Why Decision Tables are not enough: From Decision Tables to Decision Models
[2] See, http://www.omgwiki.org/dmn-rfp/doku.php, for information on the OMG DMN
[3] The presence of an irrelevant populated condition cell violates Decision Model second normal form just as an irrelevant part of a primary key in a relational table violates Relational Model second normal form.
[4] The same is true of the Relational Model. It consists of two-dimensional structures by definition and most people prefer to represent Relational tables with headings across columns and data instances down the rows.
[5] The same is true of the Relational Model. It consists of two-dimensional structures by definition and most people prefer to represent Relational tables with headings across columns and data instances down the rows.