Being a business analyst is a multi-faceted role where you are juggling numerous tasks on a daily basis. So, it is not surprising that sometimes it can feel like you can’t tell the wood from the trees. When speaking to a business analyst on a busy project, I am often told that ‘at the end of a working day, I feel like I have achieved nothing’. Even, though we may feel like that but when looking back on the day you will see that you have probably carried out invisible work. Invisible work is a concept that is frowned upon within the agile world but it is something that we are all guilty of doing. In this post, we look at what the key blockers, which can slow your workflow and why working in visually will help you overcome these blockers. By making your work visible you can reduce the amount of time you waste in a day and be able to do things that you like to do.
Blockers
There are 5 blockers that prevent you getting your work done:
1. Too much work in progress:
This is where you have to much work in-flight, so instead of finishing a task and starting the next one you are constantly starting a new piece of work. By doing this, you don’t get the opportunity to finish things as often as you would like.
2. Unknown dependencies:
At work, we have to work with others and be dependent on them to help us to achieve our goal. Dependencies really should not come as surprise but I find when I am heading towards the end of the project that is when a nasty surprise pops up.
3. Unplanned work:
This is work that has come from the left field, it usually comes from your senior management or stakeholders. I find when I have come into work and I have created a perfect to-do list that is when I will get an email asking me to do an urgent piece of work. This will then result in my to-do list going out of the window.
4. Conflicting priorities:
As business analyst we are used to conflicting prioritizes all the time in our daily lives but that does not mean that this will not have an impact on our workflow. Dealing with conflicting priorities means that you will get to use your stakeholder engagement skill set.
5. Wasted work:
We all like to think that the work that we do is going to be used. There is nothing more disheartening then to find the slide deck that you worked really hard over has not being used by your manager.
So, why make work visible
There is not getting around but people think in images instead of texts. The reason they do is that it is easier to understand and digest information in a graphical format compared to something like a report. There are also studies that claim an individual’s brain is wired in a way that it recognizes and deconstructs visual information more effectively then texts.
The great thing about working visually is that it shows you where your pain points and gaps are in your daily work life. It is only when you can see the problems you are able to create solutions to overcome the problems. It is also more powerful to see your problem presented in front of you instead of a spreadsheet or a slide deck.
One of the main reasons why I like to work visually is that I get to decide how complicated the tool is that I am going to use. When working visually the simpler the better you don’t want to over-complicate things.
Examples
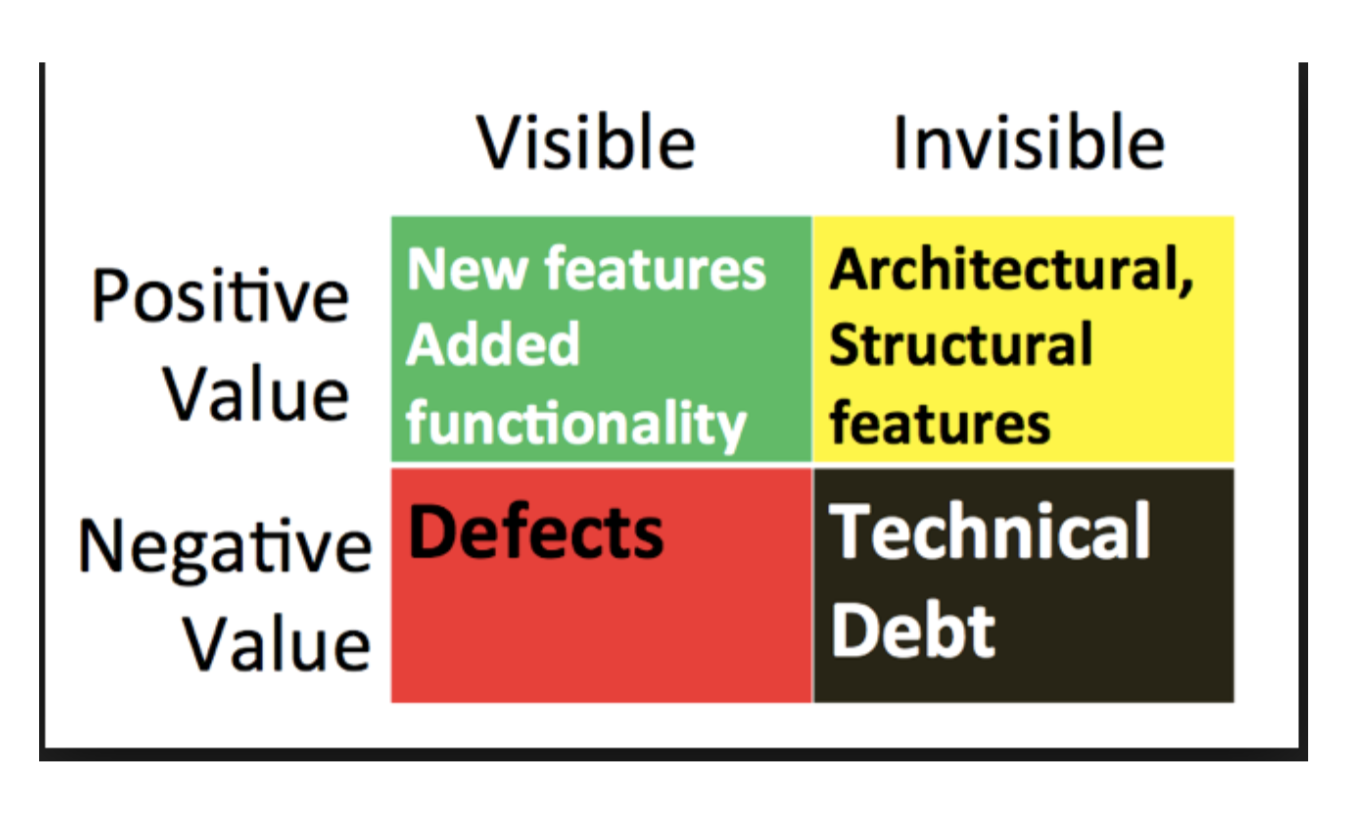
This is a brilliant example of work visually. If you work in a technology field you will have come across Philippe Kruchten visibility grid. In this grid, we can that see that things fall into four quadrants; visible and have positive value, visible and have negative value, invisible and adds positive value and invisible and has negative value. Philippe explains in his blog that this grid was designed to answer the question of ‘what is its actual value’. The aim of this grid is for the technical architects to show their products owners that actually spending time working on things that are not visible adds value to the project.
I have worked in teams, where we have used this grid and added things to it, as we have developed a product. If you work in software development I would recommend you create a blank grid like and start to populate it, to show your stakeholders what you work on and what value it adds to the end user.
Dominica DeGrandis stated that the grid achieves the four elements that are needed to make a visual tool useful; structure, usefulness, relevance, and honesty. When working visually you want to make it visually appealing (no one likes a messy board), accurate, meaningful and easy to digest.

Kanboard is a brilliant tool that is used throughout the world across multiple industries. The beauty of Kanban board is that it is simple to use and therefore easy to understand. In this tool, you can add tasks that you have to do in your backlog. When you have started a task then you move it across to 'Doing’ column. Once, the task is complete it will then be moved to ‘done’. The key thing to remember with this tool is to limit the number of tasks that you have in progress, a purist would argue that you should only have one task in this column at a time. I don’t necessarily prescribe to that method, as I think you can have a few tasks ‘in progress’.
In our next post, I will go through visual tools that you can use to show where your blockers exist in your workflow.
 Author: Rohela Rouf, Business Analyst
My name is Rohela Raouf, I have been working as a business analyst for a few years. I have had the privilege of working across multiple programmes across the technology landscape. I am currently working in public sector helping to deliver a critical product for a large government department.
I have a passion for building services around user needs and delivering them quickly- learning from the users and iterating on the product to create a product that the users want to use.
If you have any questions, feedback- let me know via twitter- https://twitter.com/RohelaRaouf