This short paper series, “Deep Dive Models in Agile”, provides valuable information for the Product Owner community to use additional good practices in their projects. In each paper in this series, we take one of the most commonly used visual models in agile and explain how to create one and how to use one to help build, groom, or elaborate your agile backlog.
State Models include two RML Data models (State Tables and State Diagrams) that show the transition of an object through various states or statuses, including which transitions are valid and what triggers an object to transition state. A state is a short-form description of a stage in a data object’s life that influences the behavior of the system.
These two models are covered together in this paper because they generally show the same information, just in different ways. These models are great for any object which has state about which there might be business rules, like workflow processes!
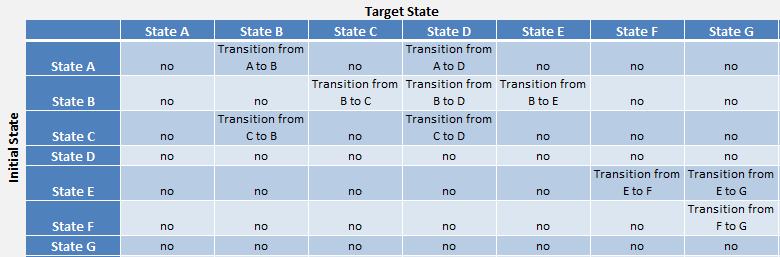
The State Table is the tabular format of state data with one State Table being created for each object that has state transitions. It consists of a table with all the applicable states for the object across the top row and left-most column. Each intersection of row and column is then systematically filled in for whether the transition is valid and what the trigger is. State Tables are especially good when the PO or BA wants to ensure that every possible transition for an object has been identified. See the example below:
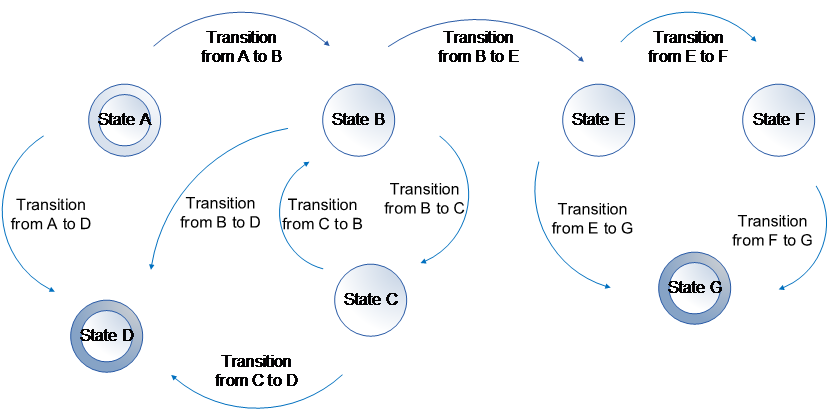
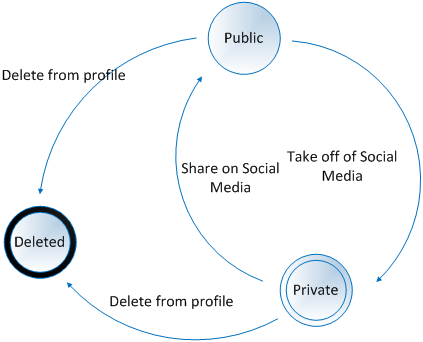
A State Diagram is a more visual way to show the transition data in a State Table by only showing the valid transitions of an object and their triggers. The State Diagram is great to illustrate the happy path and alternate paths of an object’s state lifecycle to stakeholders. While the State Table allows the PO/BA to ensure that she has considered all possible state transitions, the State Diagram is more consumable for business stakeholders. See the example below:
When would I use a State Model on an agile project?
Unlike most of the other models in this Deep Dive series, State Models are not applicable for every agile project. Projects that need State Models typically include: workflow projects and projects that have data objects with many complex decision logic or business rules around them.
If the PO or BA knows upfront in the project that the project will involve workflow (like approval processes), then she may begin eliciting the statuses or states of the workflow items in a Planning or Sprint 0 phase. This allows the system to be designed by the architects with some knowledge of the complexity of the workflow that needs to be implemented.
For most projects, State Models are created during the Execution or sprint phases, usually about 1-2 sprints before the story to implement them is worked on. The PO or BA would identify the need for a State Model, generally with clues like states or statuses for an object or a list of automated state changes in the system that need to be modeled out.
From there, the PO or BA would elicit the full list of states and potential transitions from the stakeholders, create a State Table to ensure that everything has been captured (or update if not) and, optionally, create a State Diagram to review the updated information with the stakeholders prior to the story being worked on.
If the work on the workflow or lifecycle of a data object spans multiple sprints or releases, then the PO or BA would keep the State Table or State Diagram updated with new transitions or states until the work has been completed.
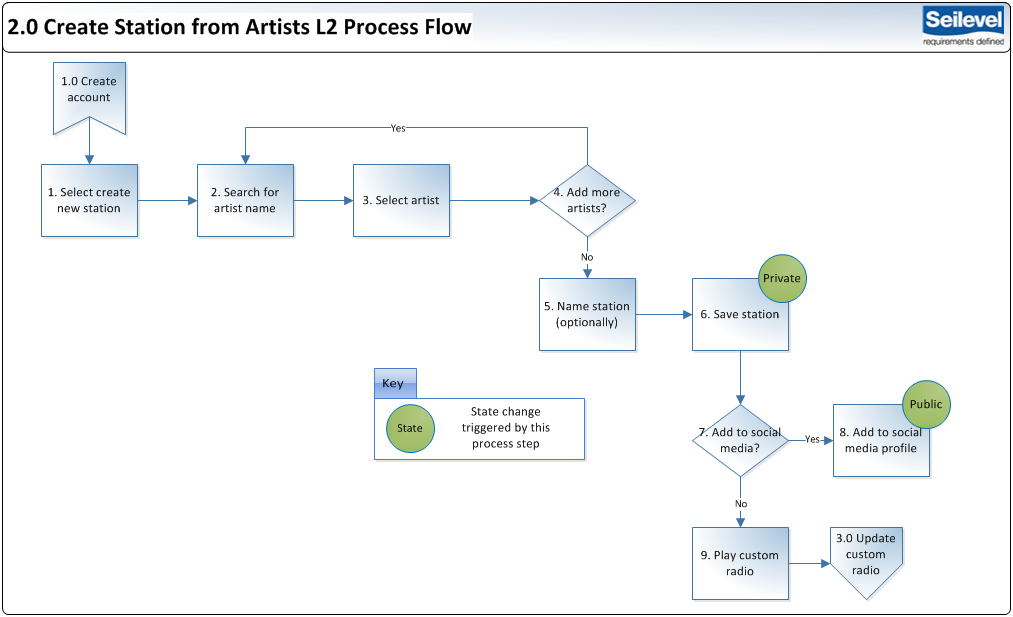
Additionally, State Models can be used with Process Flows. Once the states and transitions for an object have been identified by the PO or BA, he can overlay the states as circles on the process flow step that causes a transition. See example below:
How do I create a State Model?
To create either state model, State Tables or State Diagrams, a PO or BA must first identify an object in the system that has state. This could be something like: quotes, orders, profiles, accounts, requests, alerts, etc.
With that information, the PO or BA will work with the stakeholders to identify a first list of applicable states for the object and maybe some of the valid transition. Then the PO or BA would create a State Table.
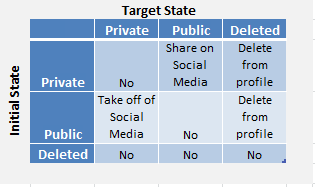
To create a State Table, the PO or BA will put all identified states in the top row of the excel table and the left-most column of the excel table. Working from column to row, the PO or BA will walk through each intersection of the states to determine if the transition is valid and, if so, what the trigger is. See the example below:
From this, the PO or BA would brainstorm individually whether any states are missing and ask questions of those to the applicable stakeholders. Finally, once the State Table is in a good place, the PO or BA may decide to create a State Diagram showing the valid transitions for easier reviewing with stakeholders.
The State Diagram covers the states (circles) and transitions (lines with text), but also adds two additional pieces of information that the State Model doesn’t: Start State and End State. In a State Diagram, transition lines should only be entering an “End State,” never leaving because otherwise it is not an “End State.”

|
The state of an object’s life-cycle that the object always begins its life-cycle in. These are typically a new or drafted type state.
|

|
A state in an object’s life-cycle from which the object can never transition out. Once the object reaches one of these states, the life-cycle is completed.
|
To create, the PO or BA will identify if the object being modeled has a start or end state, then add all states from the state table and the valid transitions with either triggers or user story references. See example below:
How do I derive user stories out of a State Model?
Once the State Table or State Diagram has been created by the PO or BA, each transition between states is likely to be a user story in the backlog and each end-to-end path (from start state to end state) is likely to be at least one epic (think happy paths and alternate paths).
For example, if the State Diagram above is the State Diagram for our project, two stories that might come out of that are:
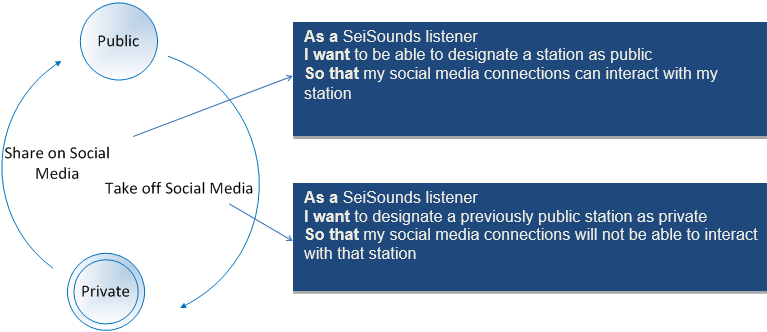
For this example, since it is a simple one (most objects with state have 5-9 states that can be transitioned between instead of just 3!), the epic might just be “As a SeiSounds listener, I want to be able to control the privacy settings of my custom radio player so that I can keep my songs private or share them with friends.”
Conclusion
State Models, while not as universally applicable to agile projects like other visual models, are great for identifying user stories and epics in workflow or similar projects. These models allow stakeholders and developers together to understand the full life-cycle of a data object and what transitions should be allowed, restricted or even automated.
This helps the PO or BA write user stories around these data objects and ensure that no edge cases of state or transitions are missing.

Author: Candase Hokanson, Senior Product Manager at Seilevel
Candase is a Senior Product Manager at Seilevel and a PMI-Agile Certified Practitioner who trains and coaches product owners, scrum masters and business analysts on agile approaches as well as championing products in those roles for clients. She works with teams to unite every team member around the common end goal of delivered business value to save up to millions of dollars in development costs for features that won’t be used or that don’t contribute to the anticipated business value. She also works with clients to help scale their agile practices beyond one team or one pilot to the entire organization.