This article is all about putting your systems analysis into context; literally and metaphorically. It’s all about drawing and interpreting the not-quite-UML Context Diagram that is sometimes referred to as the System Context Diagram.
Introduction
As just hinted, the Context Diagram has traditionally not been seen as a core Unified Modeling Language (UML) diagram, yet many UML practitioners consider it to be the logical starting point for any systems analysis endeavor.
This diagram sets out at the very highest level the system boundary; so that we can determine -- but not yet model -- what is inside the system (hence inside our scope) and what is outside the system (hence outside our scope). The idea is to put the proposed system into context relative to the external actors and other systems with which it interfaces.
The Context Diagram will typically be included in the requirements document in order to get agreement on the proposed system scope from both technical and non-technical stakeholders. As such, this diagram uses simple shapes and plain language.
Diagram Elements
The diagram elements listed below and in the subsequent worked example are based on the Gane-Sarson symbol set for Data Flow Diagrams that is covered in a separate article. Hint: a Context Diagram is a simplified version of the Data Flow Diagram invented by Larry Constantine in the 1970s (see separate article).
 |
This shape represents a Process, which in the context (no pun intended) of a Context Diagram means the whole of the proposed system. The process should be treated as a ‘black box’, the internal details of which are not important at this level of abstraction. |
 |
This rectangle shape represents an external Interface, which is any external system or human actor that interacts with our system. The Context Diagram focuses on external actors rather than internal processes. n some alternative notations the Interface shape may be known as a Terminator, an Input/Output or an Entity. |
 |
A Data Flow line gives an indication of the kind of information that flows from our system (Process) to an external system (Interface) and vice versa. The data flows in the direction of the arrow. |
As you will see in the Data Flow Diagram article, there is an additional diagram element known as the Data Store. This diagram element is not usually used on a Context Diagram because data stores are considered to be internal to the system process.
While this table of diagram elements is informative, the only way to truly appreciate the role of the Context Diagram is via a concrete worked example.
Worked Example
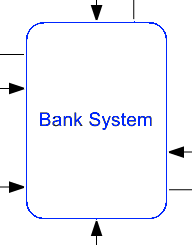
The figure below shows a Context Diagram that was drawn in Microsoft Visio as a Data Flow Diagram using the Gane-Sarson symbol set. Take time to interpret the diagram yourself, and then read the description that follows. Context Diagrams drawn using the alternative symbol sets should be just as easy to understand.
This diagram shows the entirety of our proposed Bank System encapsulated as a single process that sends data to, and receives data from, various external interfaces.
The interfaces to the right represent human actors of the kind you might find on a UML Use Case Diagram, who will interact with our system in various ways. Customers can send deposit and withdrawal requests to our system and can receive statements from it. Bank Managers can send open and close account requests to the system and can receive management reports from it. Third Parties can send third party deposits to the system, but obviously not mkae withdrawal requests.
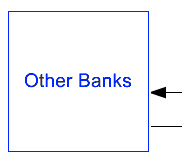
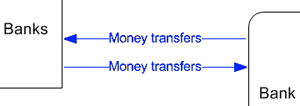
The first interface on the left of our diagram represents the Other Banks which may send or receive money transfers when interacting with our system. These other banks are likely to be system actors (i.e. computer programs) rather than human actors.
The second interface on the left of our diagram represents the Sales Agents, which are external affiliate companies or individuals who generate customer introductions for our system.
Note that while the context diagram shows the kind of data that is exchanged between our system and the external interfaces, it implies nothing at all regarding the sequence in which those data exchanges take place.
Tips and Tricks
What is not shown on the context diagram is just as important as what is shown. If an external actor or system does not appear on the diagram, it is ‘out of scope’.
You might find that your diagramming or modeling tool does not support the Gane-Sarson symbol set for drawing Context Diagrams in the style of Data Flow Diagrams. In this case it is perfectly acceptable to draw a Context Diagram using the UML Use Case Diagram notation as shown below.
In this alternative notation a single Use Case symbol is used to represent the entire system and an Actor symbol is used to represent each of the external interfaces.
The alternative UML Use Case Diagram notation leads us on to thinking about how we might transition from the high-level system context to a functional decomposition of use cases. We already have a starter list of actors -- Customers, Bank Managers and Third Parties -- and the labelled data flows hint at the use cases we might need: Deposit, Withdrawal, Open Account, and so on. Ultimately this may lead to the creation of a UML Use Case Diagram as shown below, in which the previously hidden details of the Bank System are now defined.
Other alternatives to the DFD-based Context Diagram include the IDEF0 Top Level Context Diagram, the Enterprise Data Model, and the Architecture Interconnect Diagram. Where these more comprehensive notations are used, care should be taken to ensure that the resulting diagram still meets the objectives of the Context Diagram; i.e. a simple presentation of the main data flows between our (back box) system and its external interfaces.
More on Context Diagrams:
Next Stop: the Data Flow Diagram
We have already hinted at the similarity between the Context Diagram elements and those utilised by the Data Flow Diagram. In fact, a Context Diagram is in effect a simplified Data Flow Diagram with one all-encompassing central process. This should have whet you appetite to find out more about Data Flow Diagrams proper, which will be our next port of call.
Author : Tony Loton - Author & Self-Publisher
As a former IT consultant and consultancy practice manager, Tony has published many IT feature articles and books including the most recent "UML Software Design with Visual Studio 2010"