 This blog begins a series on BA tools, based on my book “The Business Analyst’s Handbook”. In each blog, I’ll be moving through the alphabet, highlighting a BA tool that begins with the letter of the day (not quite Sesame Street, but not PeeWee ‘s Playhouse either). Today’s letter is “A” – for activity diagram.
Example:
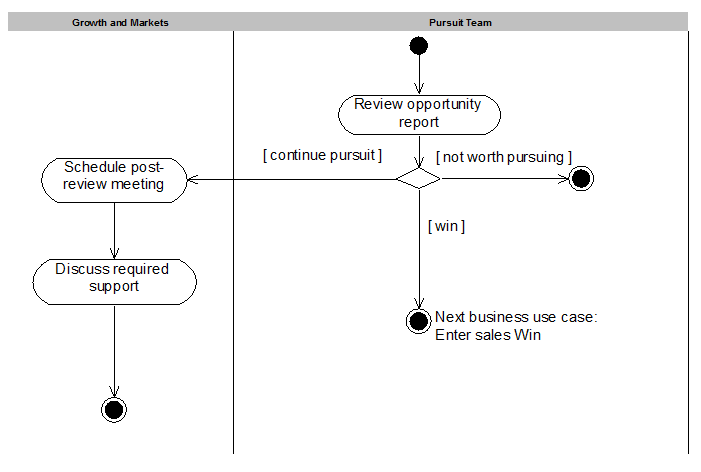
The following activity diagram example describes a portion of the workflow for the business process, Review Pursuit – one of the processes within a Customer Relations Management (CRM) system. The two participants in the process are represented by the columns (referred to as swimlanes, or partitions), named “Growth and Markets” and “Pursuit Team.” The example indicates that the process starts when a Pursuit Team reviews an opportunity report. If the review has determined that the opportunity is not worth pursuing, the process ends. Otherwise, Growth and Markets schedules a post-review meeting and discusses required support.
This kind of diagram could have also illustrated which computer systems automated which activities, by depicting the systems as swimlanes - and, in fact, this is precisely what was done in the real case from which this example was derived.

Background on the example:
A number of years ago, I did some consulting for a financial investment firm. The goal of the project was to improve the business process workflow for tracking opportunities and proposals in a Customer Relations Management (CRM) system. The company had been using a number of software products to handle the process – CMS Open for one aspect and PeopleSoft for another. Amongst other things, they were unhappy with the amount of double entry they were doing – entering client information on one system while an initiative was at the proposal stage and doing it again on another system once the proposal was accepted. As a first step, I was asked to develop an As-Is workflow diagram for the current process. Suspecting that one must already exist, I asked to see it but was told that no, there was no diagram. After a while in this business, you develop a sixth sense for detecting when somebody is holding something back so I persisted – and sure enough, the interviewee pulled one out of his desk drawer. I knew it wasn’t perfect (which is why he hadn’t wanted to show it to me) but I was glad to have it – as it was a great aid in facilitating group interview sessions. It’s much easier to look at something and find the errors than to begin from scratch; or another way of putting it: better to have a straw man than no man at all.
The diagram I used showed the steps of the process and indicated who or what system was responsible for each step. This type of diagram is known by many names: Flowchart (which often only shows the sequence of actions but not who does them), Swimlane Workflow Diagram (where the doer of each action is shown) and (if you are using the UML standard) an activity diagram (which may or not show the doer, depending on how it’s drawn).
Context
Activity diagrams are useful in the situation I’ve described – when you need to analyze the workflow of an existing (As-Is) or future (To-Be) business process. In the UML, (using Rational Unified Process [RUP] terminology) are used this way when specifying business use-case realizations (descriptions of the internal workflow used to execute business processes). In this type of situation, they are drawn so that the doer is shown – by indicating a swimlane (or ‘partition’) for each participant.
Another context for using activity diagrams is in describing system use cases. A system use case is a user task – typically a task that a computer user expects to accomplish in a single session on with a software system. The requirements for the interaction between the user and system are usually described in text, but an activity diagram is added if the steps within the text connect to each other in complex ways. (The document that houses all of this is called, in RUP, a ‘use-case specification’.)
Howard Podeswa, author of Noble Inc.